How to Find the Videos That Work
Most of your views come from a few videos. Track every post across TikTok, YouTube, Instagram, Facebook and X to see which ones, and make more like them.
Every month, a few of your videos bring in most of your views. If you track every post, you can see which ones they are and what they have in common, then make more like them. If you do not, planning the next month is mostly guesswork.
Tracking is the hard part when the same video goes to TikTok, YouTube, Instagram, Facebook and X, because each platform reports its numbers separately. Rendley Studio now has an Analytics page that puts the video analytics from every platform on one screen.
To show how it works, we made up an example: Northside Makers, a weekend market where local bakers, potters and growers sell their goods. The market posts short videos about its vendors on every platform. Below, we walk through one month of its videos to spot what worked and how to make more of it. The brand and all the numbers in the screenshots, including the benchmarks from other creators, are fictional.
See which videos carried your month
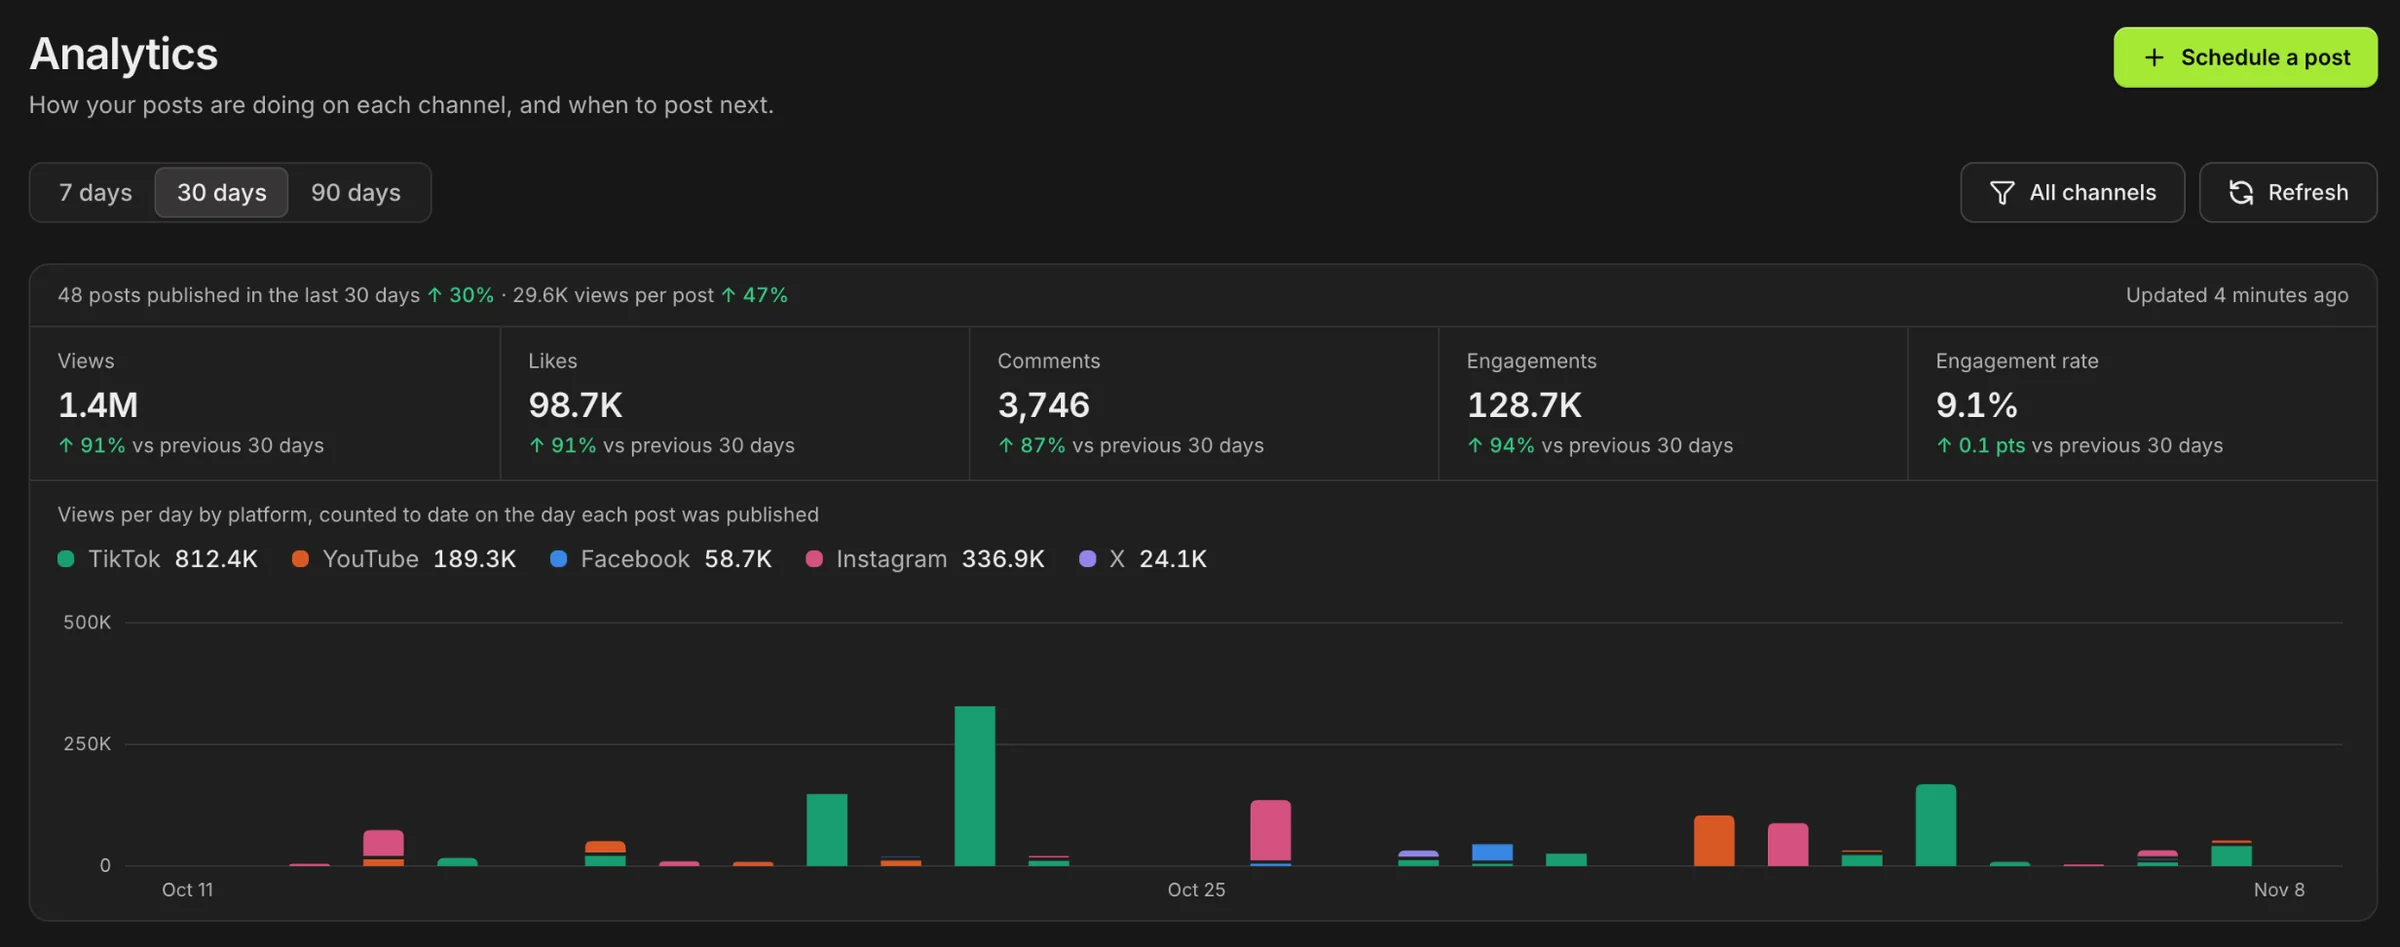
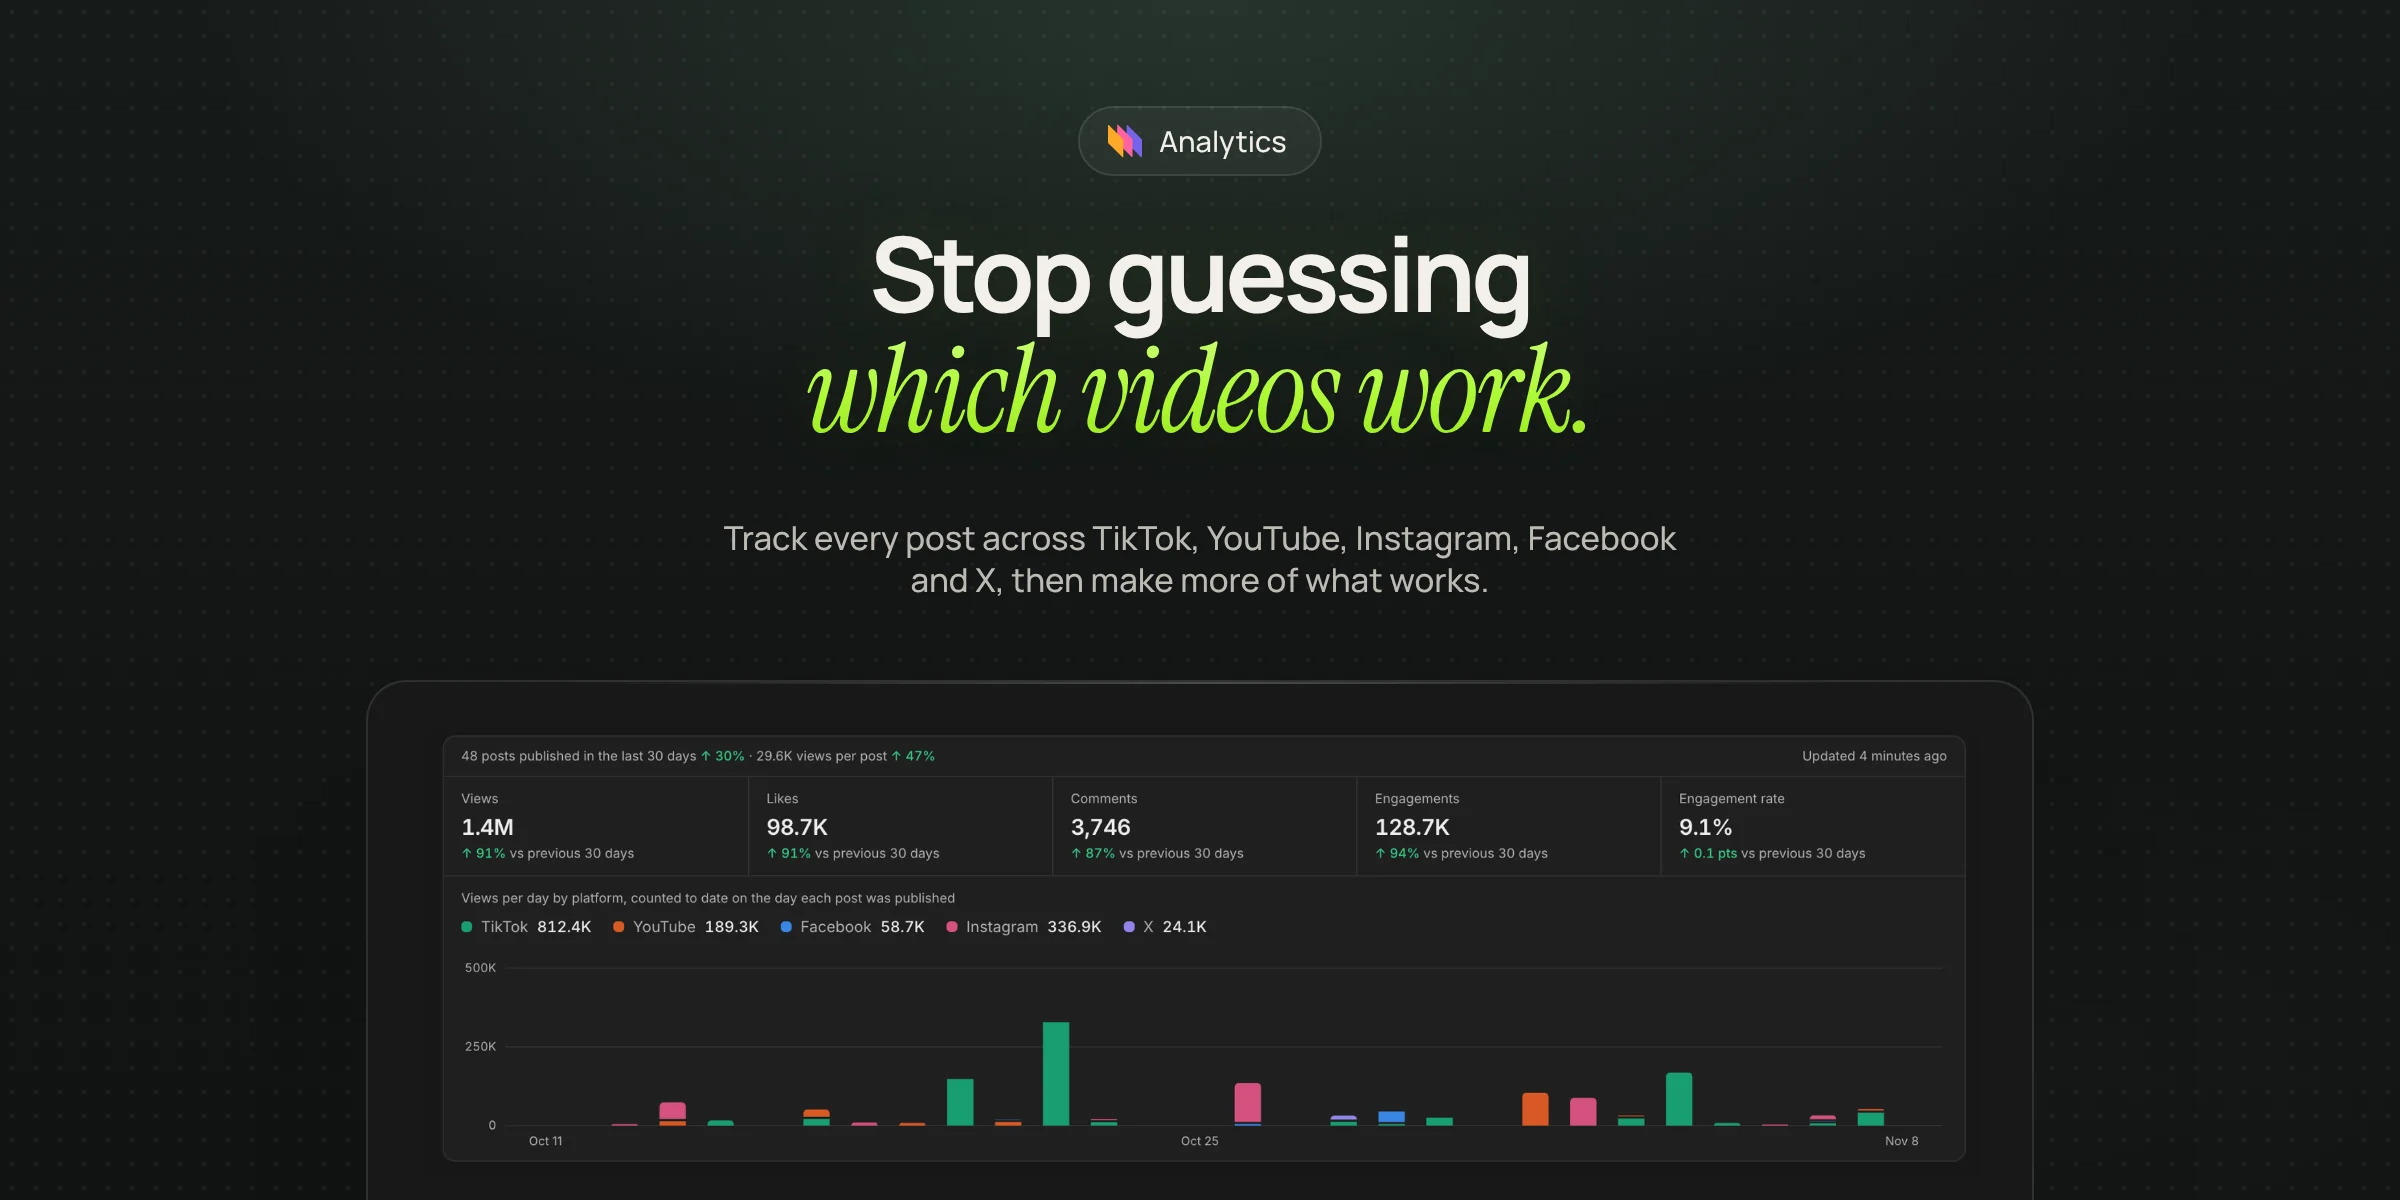
The top of the page shows views, likes, comments and engagement for the last 7, 30 or 90 days, compared with the period before. The chart places each post's views on the day it was published, so one big video shows up as one tall bar.
Northside Makers got 1.4 million views from 48 posts last month. One TikTok, in which one of its bakers explains why he rests his sourdough for 48 hours, brought in 312,400 of them, more than the next two videos combined. That is the tall green bar on October 22.
Find what your best videos have in common
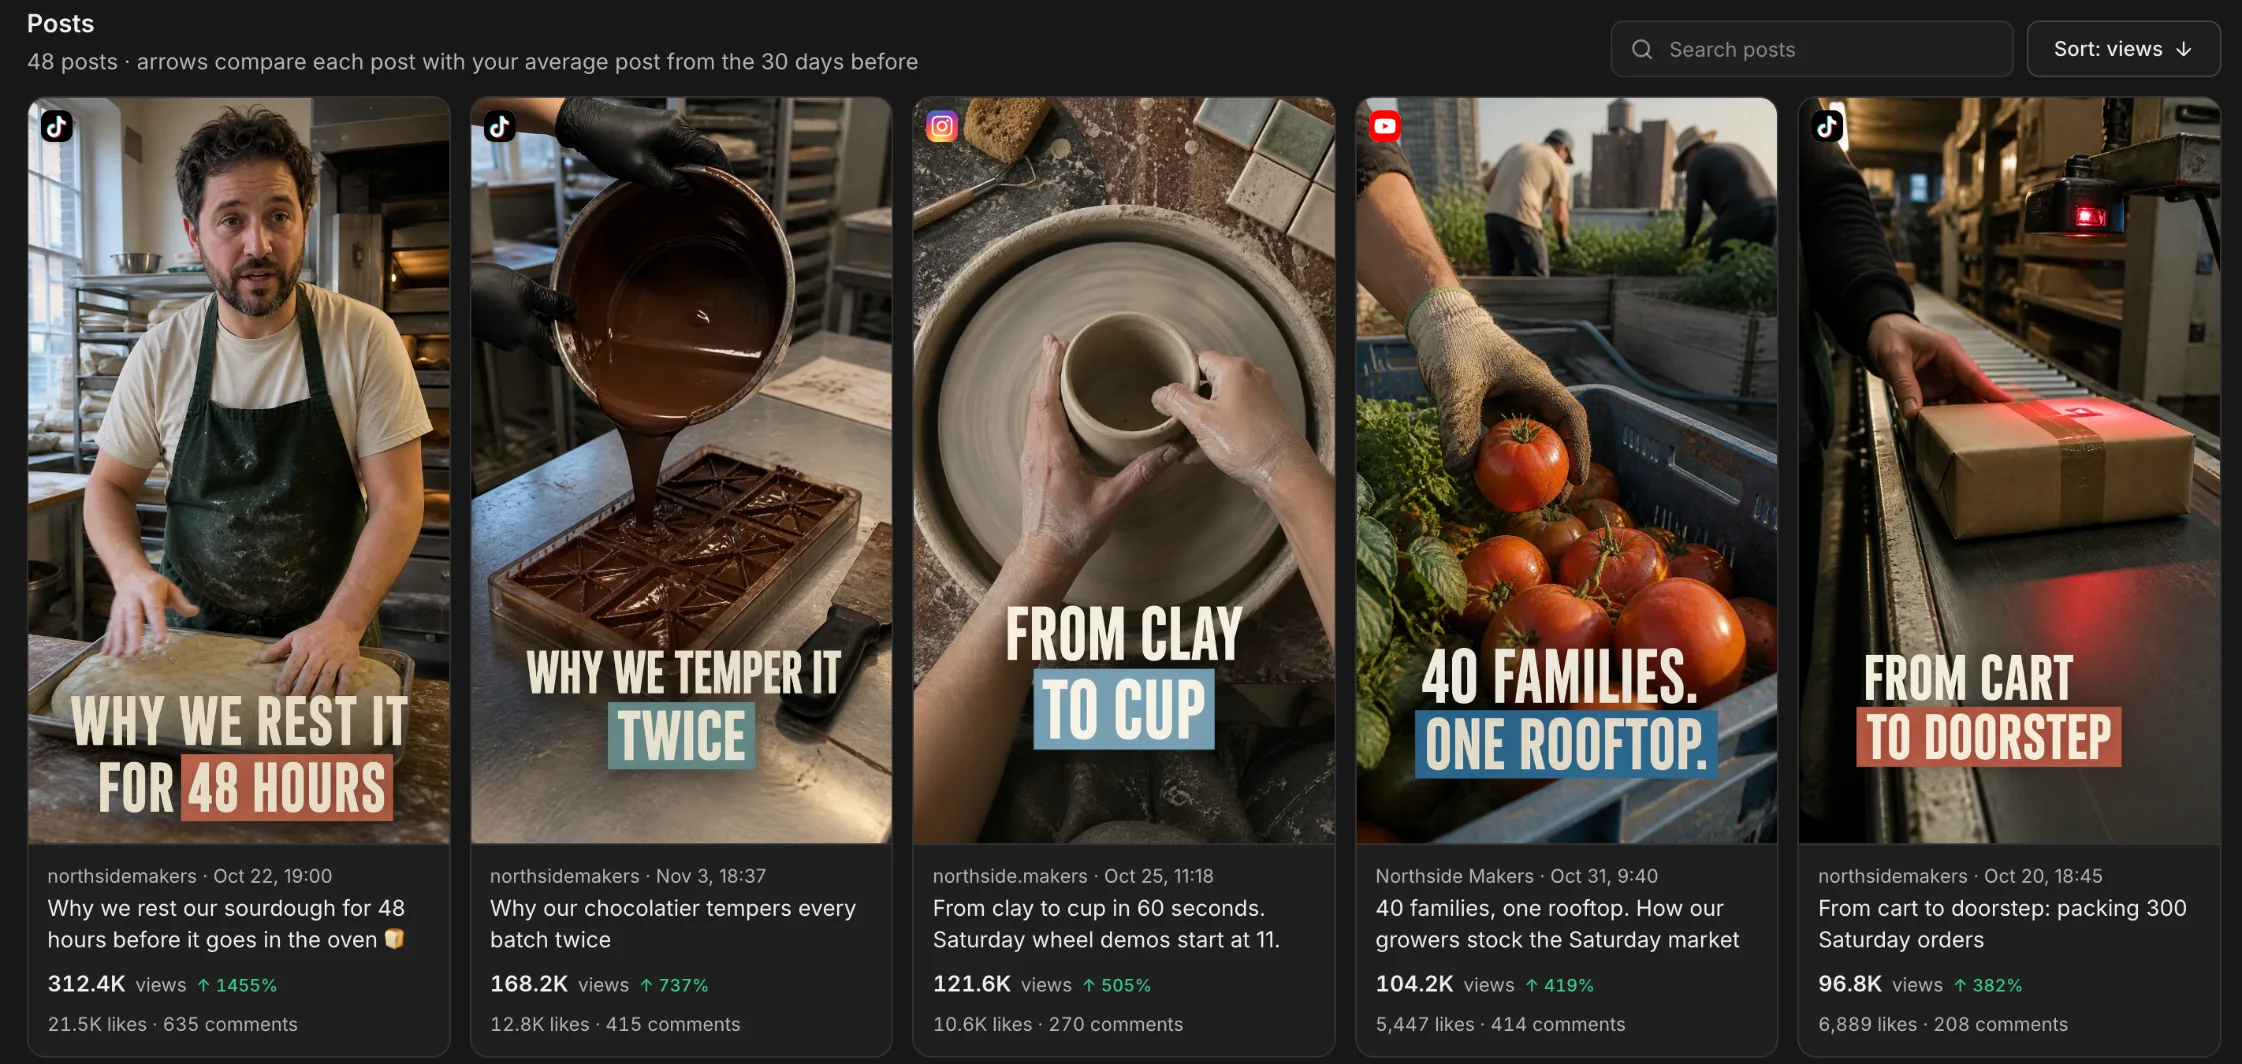
Posts are listed newest first. Sort them by views and look at the top five side by side. All five take you behind the scenes, and three show how something gets made: why the dough rests, why the chocolate is tempered twice, how a lump of clay becomes a cup. None of them is a sales pitch. That gives Northside Makers a format it can repeat every week.
See where viewers drop off
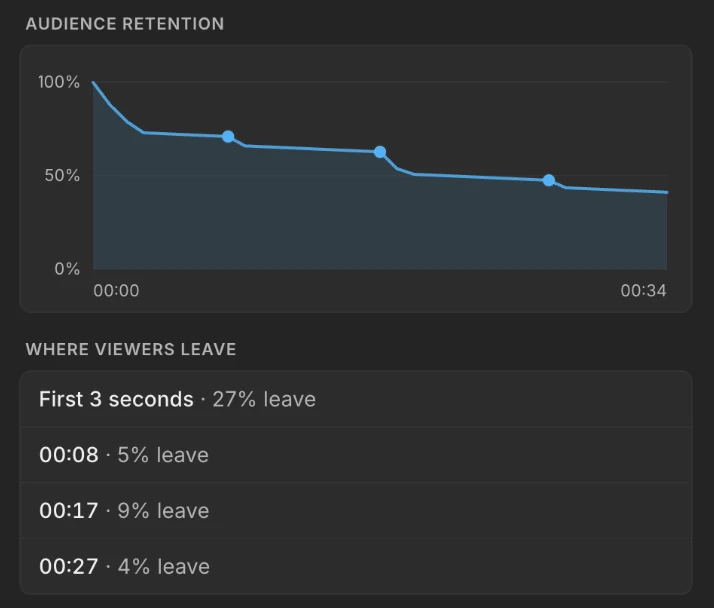
For TikTok business accounts and Facebook videos, opening a post shows its retention curve and the moments where viewers left. On the sourdough video, 27% of viewers left in the first three seconds, and the biggest drop after that, 9%, came at 0:17.
Losing viewers in the first three seconds points to the hook. A drop at 0:17 points to one moment in the edit. If you posted it from Rendley, open its project, go to 0:17 and look. It is usually something small, like a slow cutaway or a pause that runs too long, and easy to avoid in the next video.
Instagram, X and TikTok personal accounts do not share a retention curve, and YouTube's is not available in Rendley yet. For those posts you see the views, likes, comments and shares.
Decide where and when to post
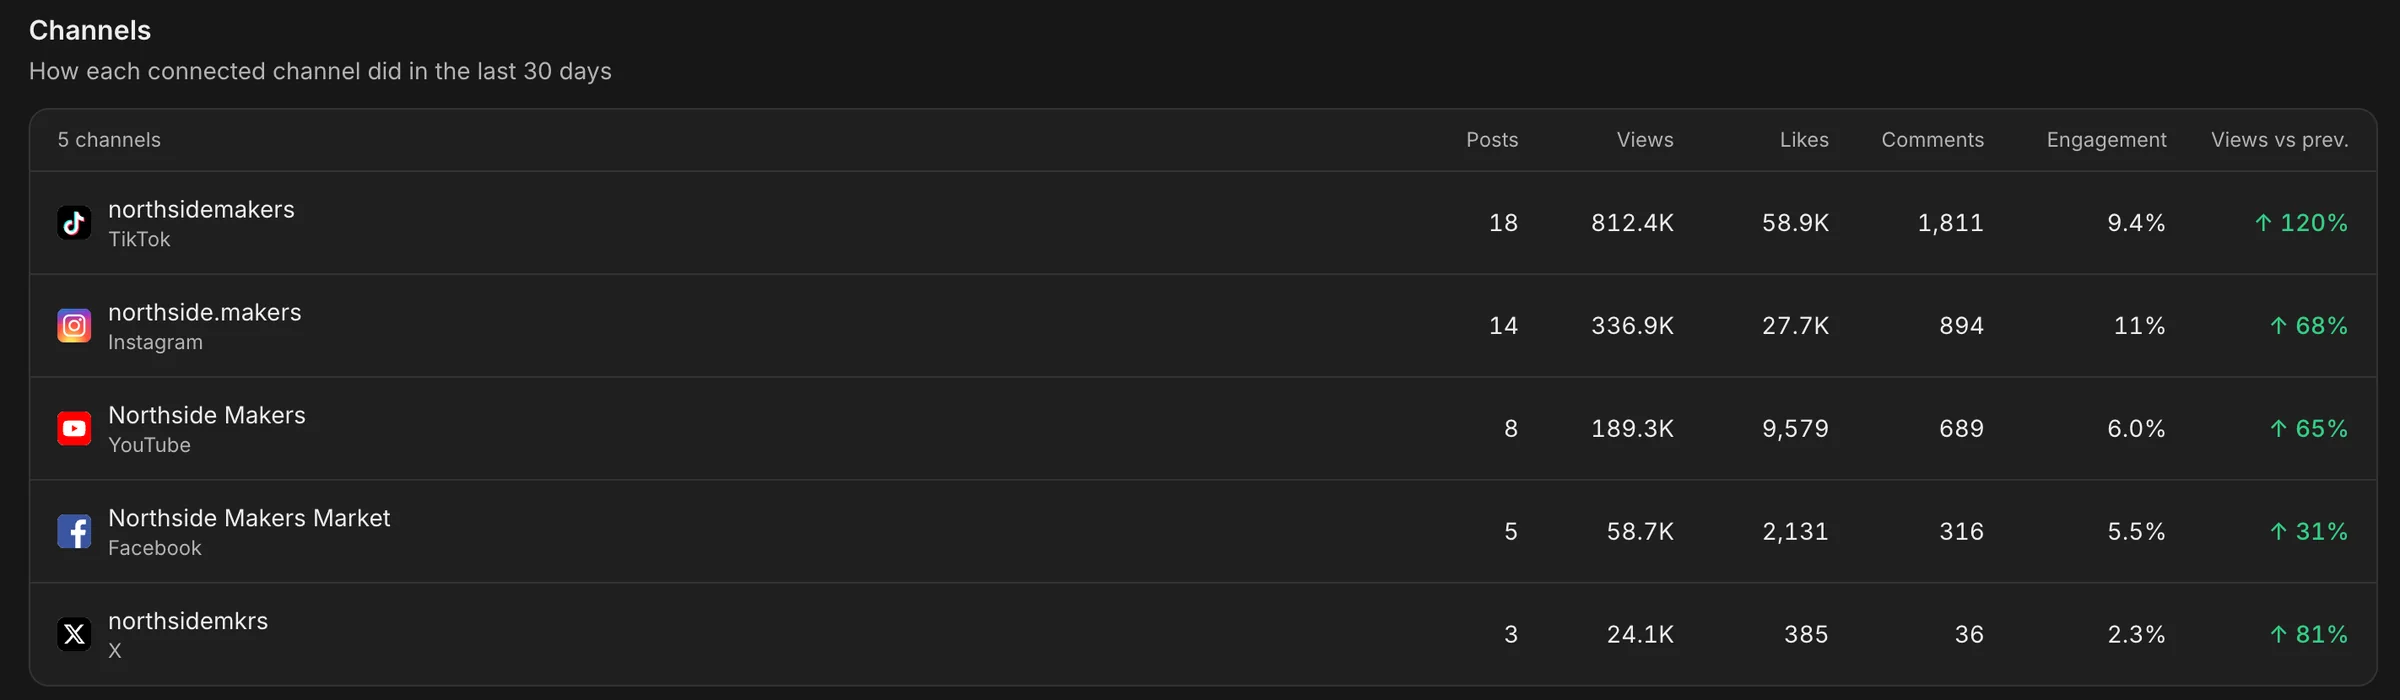
Some platforms do far more for you than others. Northside Makers' TikTok posts averaged about 45,000 views each and its X posts about 8,000, while Instagram had the highest engagement at 11%. So the next batch goes to TikTok and Instagram first, with auto reframe making the vertical and 4:5 versions from one edit.
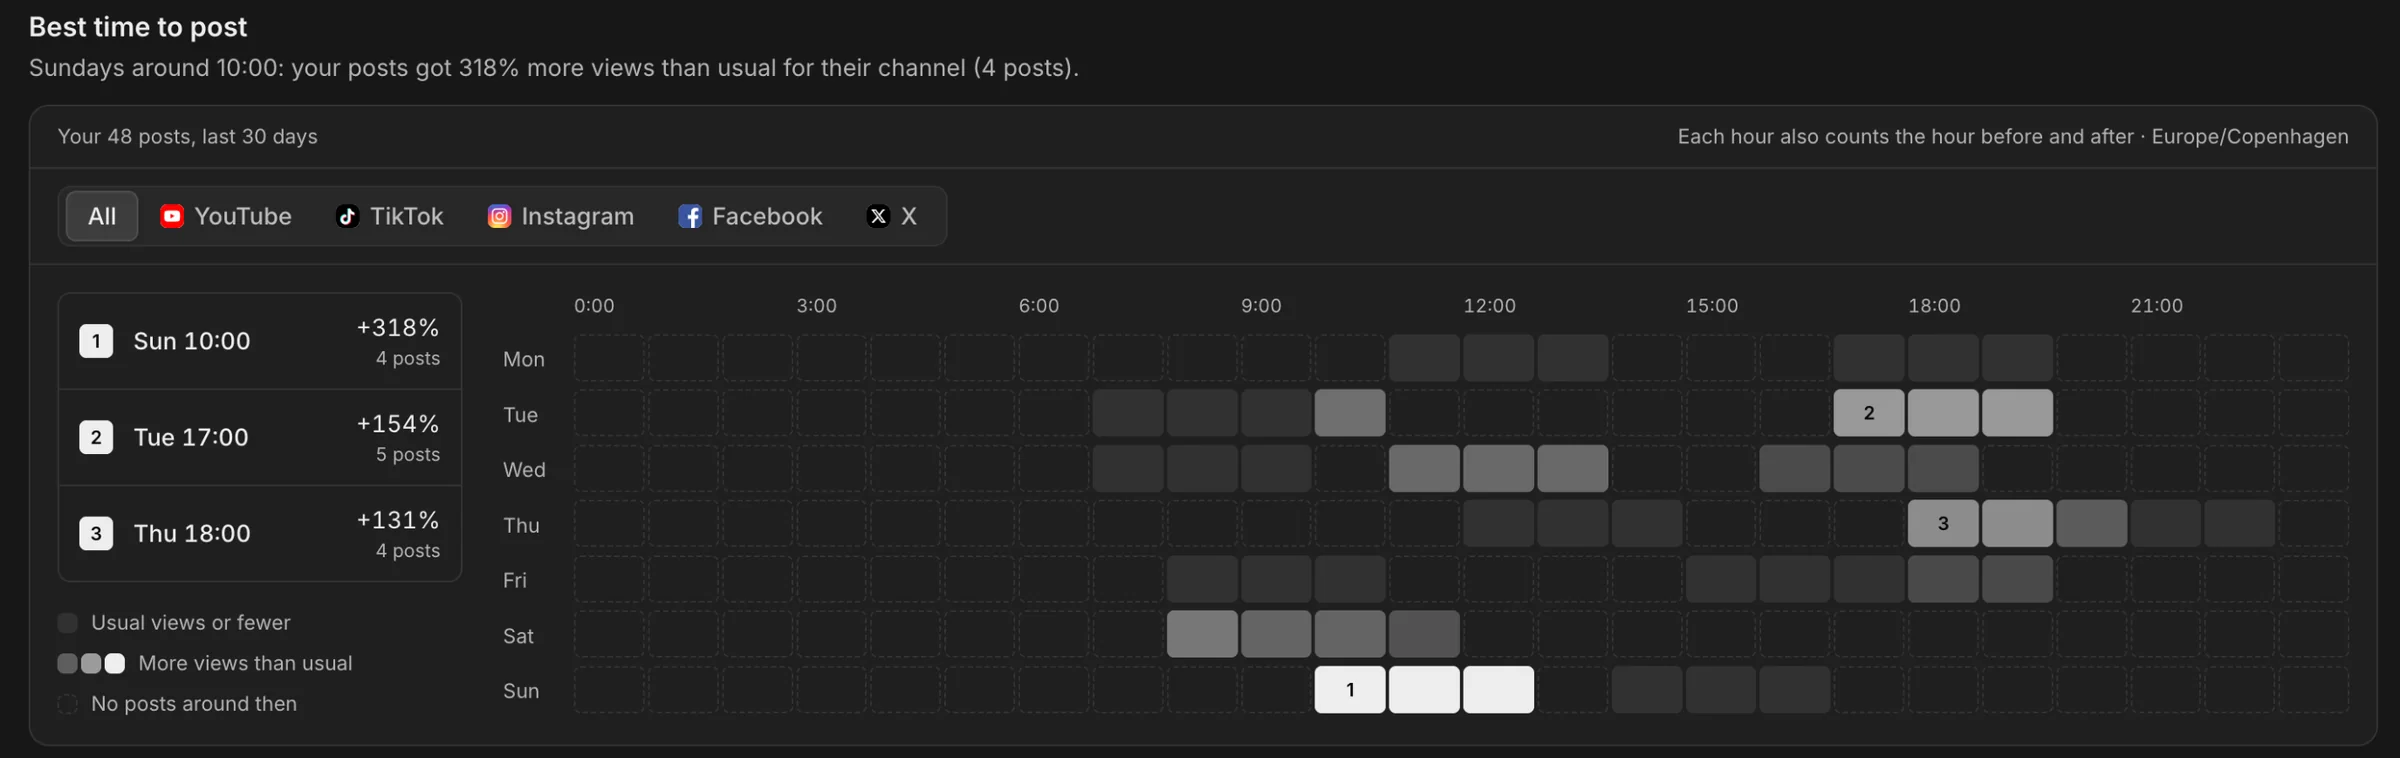
Timing matters too. The Best time to post heatmap is built from your own posts. It compares each one with the usual results on its channel, shows days and hours in your time zone and only ranks a time once at least three posts back it up. For Northside Makers, the best slot is Sunday around 10:00.
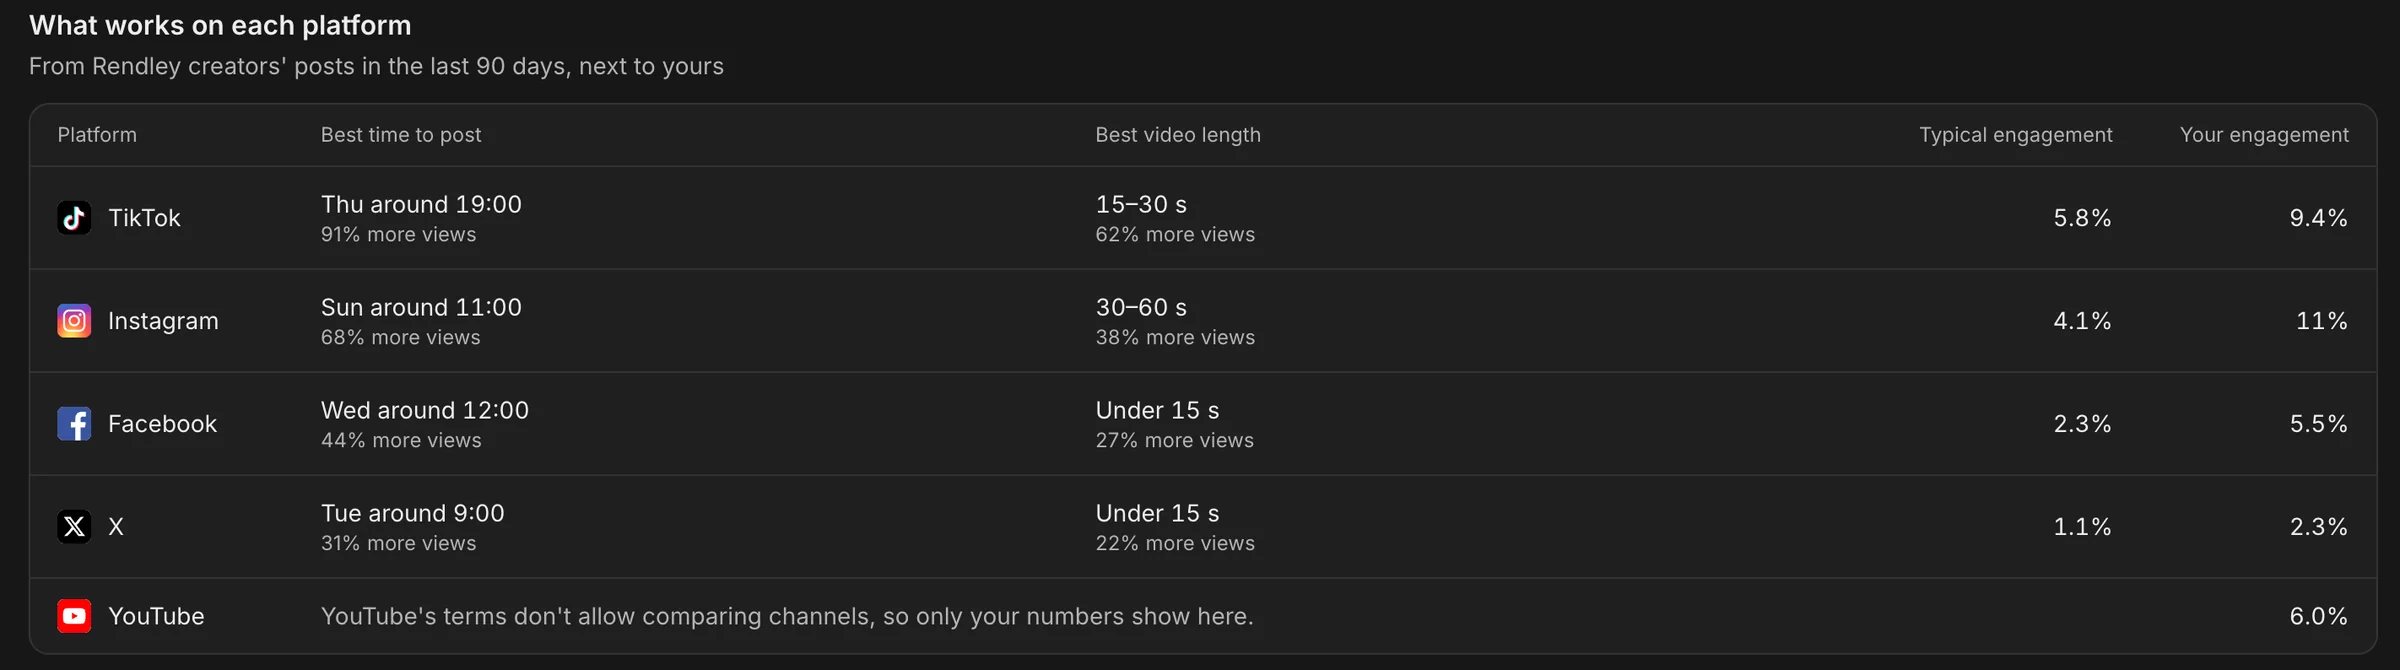
If you are new to a platform and have few posts there, the What works on each platform table fills the gap with results from other Rendley creators over the last 90 days. Across creators, TikTok clips of 15 to 30 seconds got 62% more views than usual. YouTube's terms do not allow comparing channels, so YouTube only shows your own numbers.
Make more of what works
Once a week, run through this short routine:
- Sort the last 30 days by views and write down what the top five have in common, such as the topic, the length or the first line.
- Check where viewers dropped off on the best one, and avoid that in the next video.
- Make the next batch in the same format. In Rendley Studio you can give the AI agent new footage with a brief such as "Cut this into a short vertical clip: open with the question, show the process up close and give the answer at the end." To turn long recordings into a steady supply of clips, see how to automatically create and post YouTube Shorts.
- Schedule the batch in the content calendar at your best time slots, then check the numbers again a week later.
Start with last month's videos
Analytics is on the Pro and Business plans. Connect TikTok, YouTube, Instagram, Facebook or X in Settings, under Social channels, then open Analytics in the sidebar. Posts you uploaded outside Rendley are included too. If a channel was connected before Analytics launched, reconnect it once so Rendley can read its numbers.